")
Understanding Communities—Their History and Current Conditions
Community Analysis:
Purpose: This chapter describes the first step of the community analysis, which includes developing an understanding of a community’s history, socioeconomic and political characteristics, assets, and resources. At this stage, a consensus organizer gathers information about the community, including a community’s history, information on current conditions and how the community has changed over time (i.e., demographic, economic, and social characteristics), and prior relationships with neighboring communities. Several methods for gathering and analyzing information are discussed, including conducting walking and windshield surveys of the neighborhood, securing census data on the community available through the U.S. Census Bureau, and using geographic information systems (GIS). A set of strategic questions are provided to help participants conduct this step of the community analysis. In addition, a case study demonstrates how Step One of the community analysis was applied in a consensus organizing project in Palm Beach County, Florida.
Learning Objectives:
- To describe and examine the overall goals and objectives of Step One of the community analysis.
- To identify and describe the strategies and methods for gathering information on a community’s history and current conditions.
- To demonstrate how the strategies and methods for gathering information on a community’s history and current conditions were applied in a consensus organizing project.
- To apply the strategies and methods for gathering information on a community’s history and current conditions to an actual community.
Keywords: community history, socioeconomic characteristics, political characteristics, census data, geographic information systems, windshield survey, assets, resources.
Overall Purpose of Step one of the Community Analysis
The goal of Step One of the community analysis is to gather information about the community, make initial contacts, and get an overall picture of the community’s history, current conditions, assets, resources, and social, economic, physical, and cultural characteristics. Consensus organizers gather information about a community by interviewing residents, and gathering information such as census data. They also get a visual picture of the neighborhood by conducting walking and windshield surveys. Historical and current information on the community is gathered from community and organizational Web sites, newspapers, and interviews with residents and community organizations. Some of the areas to analyze in Step One of the community analysis include:
- the community’s actual name and if that differs from the name residents give the community;
- the physical boundaries and characteristics of the community;
- when the community began, who the first inhabitants or immigrants were, and important historical events that have occurred in the community;
- who lives in the community, where they work, their income levels, and their family sizes and status;
- the type and condition of housing and the ratio of renters to homeowners;
- the conditions of the commercial district, the types of businesses located there, who owns them, and if residents are employed at neighborhood businesses;
- the major institutions in the community, including schools and hospitals;
- places where people gather (e.g., playgrounds, street corners, community centers); and
- political activity in the neighborhood (e.g., involvement of government representatives, voting patterns).
Gathering Information About the Community
There are a number of resources relating to communities from which information can be gathered. Beyond simply walking around neighborhoods, consensus organizers can collect public and private publications about the community, including newspaper articles, historical records, reports on previous programs, and information from local government, community, and organizational Web sites. Organizers can also ask community members about where the best places are to gather information about the community and where to begin their search. Information about the community can also be gathered by connecting with major institutions and agencies in the community, attending public functions, gathering information from libraries and local planning departments, and reviewing census data. The goal is to canvass all available resources to obtain a diversity of information so that a realistic picture of the community can be painted.
Conducting Walking and Windshield Surveys
A “walking” survey typically involves choosing a location that is an active area of the community (e.g., preferably a business district) and walking through the area during the daylight hours. A “windshield” survey involves driving through the community to get a visual picture of the community. Exactly as the name implies, the organizer drives through the assigned neighborhood and observes and notes what is visible through the windshield.
Typical windshield surveys will give the consensus organizer an overall sense of the neighborhood’s physical conditions, including the condition of the housing, public amenities (e.g., parks and community centers), institutions, or businesses in the area. The physical appearance of a community tells one part of the story and may help fill in gaps that census data do not reveal. For example, you might have census data that show the percentage of homeowners or vacant units in a community, but a visual picture of the neighborhood tells you the condition of the housing. Second, census data may be a few years old, so it’s important to observe demographic patterns. For example, the census may indicate that 10% of the population is Hispanic; however, when you drive around the neighborhood, it appears as if there are more Hispanics in the neighborhood than indicated by the census data. Housing markets and conditions can also change rapidly, particularly in areas affected by gentrification. A windshield survey can be done on a regular basis to determine the status of buildings in a neighborhood. Typically a set of criteria will be determined up front, so that each time the survey is done you are comparing “apples to apples.” For example, government agencies may rate exterior building conditions on a scale of 1 through 5, with 1 being excellent condition and 5 being condemned. By understanding the government’s system, you can examine the ratings on specific buildings, and conduct your own windshield survey to keep up-to-date information on their condition. Community organizers use windshield surveys throughout the organizing process to supplement data and gain important observations about the community.
While windshield surveys have their place, the best way to get to know a neighborhood is to explore it on foot. By walking around the neighborhood, the consensus organizer gets a feel for the community and will naturally meet people along the way. An easy way to do this is to begin by visiting business establishments in the area. You might be surprised at what you will learn about the neighborhood by having lunch at a local café or getting a haircut at the local barbershop or hair salon. You might also find that people you meet at these establishments can help you make connections to residents and other groups.
When conducting the windshield and walking surveys, it is important to use safe practices. If possible, conduct the surveys with at least one other person. It is also a good idea to conduct the surveys with a neighborhood resident, or at least get feedback from people who live and work there (for example, homeowners, clergy, neighborhood leaders, or local business owners) about when it is safe to explore the neighborhood. In addition, contact local community police officers to ask for their advice about when it is safe to explore the community. You should also consider conducting the surveys during daylight hours if you are alone. For example, if you do your tour on a sunny Saturday afternoon, you are likely to see and meet more people. Consider visiting other public spaces where people might congregate, such as a public park, the neighborhood library, or the schoolyard at the beginning or end of the school day. All are great spots to observe and meet people. You may also want to start by attending a public meeting in the neighborhood first, to get feedback from residents about conducting the surveys.
Organizers for the Neighborhood Development Program of the Family Service Association in Dayton, Ohio, once worked in a neighborhood where mistrust was so high it was impossible to have house meetings. Local institutions also had mixed reviews, and all were nonsmoking establishments. One of the community organizers held many of her first organizing sessions in the local laundromat and a doughnut shop. The owners of both businesses were open to the organizer and residents having meetings at their places of business because the organizer had previously built relationships with these owners during a walking tour of the neighborhood. Another community organizer from the Dayton program loved basketball, so he would always look for a pickup game in neighborhoods he was working in. He was able to meet many people right away, and have fun too! One of the other organizers had a sweet tooth. If the neighborhood had a bakery, candy store, or ice cream parlor, that’s where she went first! A neighborhood tour can be fun. As you meet people in the community, your comfort level will rise and you will find yourself naturally spending more time on the block level. Remember to make your first interactions count and build on people’s strengths. Don’t be alarmed that within a short time of your being in the neighborhood, everyone will know who you are.
Gathering and Understanding Census Data
Table 6.1 describes the major types of census data that a consensus organizer might gather in Step One of the community analysis, including the overall demographic characteristics of the neighborhood, and social, economic, and housing characteristics. Make sure you get as up-to-date information as possible from the U.S. Census Bureau and local government planning, housing, community development, and social service departments. The Census Bureau Web site (www.census.gov) allows users to get census track as well as block level data, making it much easier to get specific neighborhood level data. In addition, you may want to compare data over time to illustrate changes that may have occurred in the neighborhood.
| Type of Data | Information to Gather |
| General Demographics | |
| Total population Population growth rate | Current population and change over time (change over past 10 years—for example, comparing the year 2005 with 1995) |
| Gender | Number and percentage of males and females |
| Age | Median age; number and percentage of various age groups |
| Race/ethnicity | Number and percentage of major racial and ethnic groups |
| Households by type | Number and percentage of family, married, single female, nonfamily, living alone, and living alone/over 65 years old |
| HH/family size | Average household size; average family size |
| Social Characteristics | |
| School enrollment (3 years and over) | Number and percentage in nursery/preschool, kindergarten, elementary, high school, and college or graduate school |
| Educational attainment (25 years and over) | Number and percentage with no diploma, high school graduate/GED, some college/no degree, associate’s degree, bachelor’s degree, and graduate/professional degree |
| Marital status | Number and percentage of never married, now married (except separated), separated, widowed, and divorced |
| Fertility | Number and percentage of women by age group (married and unmarried) who had a birth in the past 12 months |
| Grandparents | Number and percentage of grandparents living with grandchildren under 18 years old by gender, marital status, labor force, and poverty status |
| Residence 1 year ago | Number and percentage in same house, different house, living abroad |
| Language spoken at home | Number and percentage by language (English only, other than English) |
| Economic Characteristics | |
| Employment status (18 years and over) | Number and percentage in the labor force, armed forces, employed, unemployed, not in labor force (overall, by gender and race or ethnicity) |
| Occupation of employed labor force | Number and percentage by major occupation |
| Commuting to work (16 years and over) | Number and percentage who drove alone, carpooled, used public transportation, walked, other, or worked at home |
| Income | Number and percentage by income categories |
| Poverty | Number and percentage of individuals, families, and children below the poverty level overall and by race/ethnicity |
| Housing Characteristics | |
| Housing occupancy | Number and percentage of occupied and vacant units overall and by rental and owner-occupied status |
| Housing tenure | Number and percentage of owner and renter occupied units |
| Occupants per room | Number and percentage by number of occupants |
| Housing values | Median housing value of owner-occupied housing |
| Rental values | Median rental rate; and gross rent as a percentage of household income |
RESOURCES: www.census.gov; local government planning/community development departments.
Table 6.2 provides a series of questions a consensus organizer might ask as he or she analyzes the data. This data, combined with the information obtained through walking and windshield surveys, interviews, news clippings, and Web sites, should help to paint a picture of the community.
General Demographics:
|
Social Characteristics:
|
Economic Characteristics:
|
Housing Characteristics:
|
Overall:
|
Using Geographic Information Systems in the Community Analysis
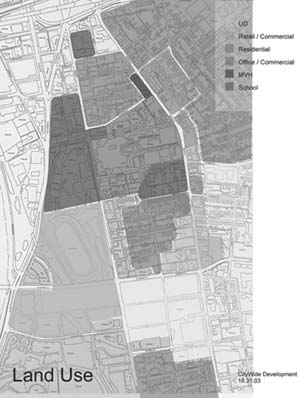
Geographic information systems (GIS) can help community organizers track their initiatives better, as well as make this information more accessible to residents and other key stakeholders they are working with. GIS allows organizers to capture, store, manipulate, analyze, display, and integrate spatial (e.g., geographic) and nonspatial data (e.g., administrative data such as census data; Maguire, 1991). For example, information on housing conditions, population characteristics, land use, neighborhood institutions and assets, social services, and public safety can be stored and analyzed using GIS (Coulton, 2005).
Consensus organizers can use GIS to map and plot the data collected through the community analysis. Mapping helps create a visual snapshot of the neighborhood that is easy for everyone to understand, from financial stakeholders to residents at a neighborhood meeting. For example, a simple color-coded map depicting homeowners’ properties and rental properties can convey a statistic more quickly than presenting raw numbers. Mapping also becomes a strategic tool in community organizing efforts. For example, Figure 6.1 displays hypothetical information a consensus organizer could collect from his or her initial round of interviews for the community analysis. Figure 6.1 displays the areas of greatest concerns to residents, including housing conditions, crime, and out-of-school youth. Each home in the area is coded to indicate the priority concern of each resident whom the organizer has interviewed. As the organizer continues to develop relationships in the neighborhood, other patterns may emerge; however, the initial snapshot is helpful in building connections among residents regarding common concerns and working with residents to develop initial solutions to address their concerns. For example, Figure 6.1 demonstrates that residents on Catalpa, Ravenwood, Shelton, and Auburn Streets are concerned about crime. Perhaps this is an area where the organizer can begin to bridge relationships between residents and help them develop a small project, such as a neighborhood watch group, to begin to address crime issues.
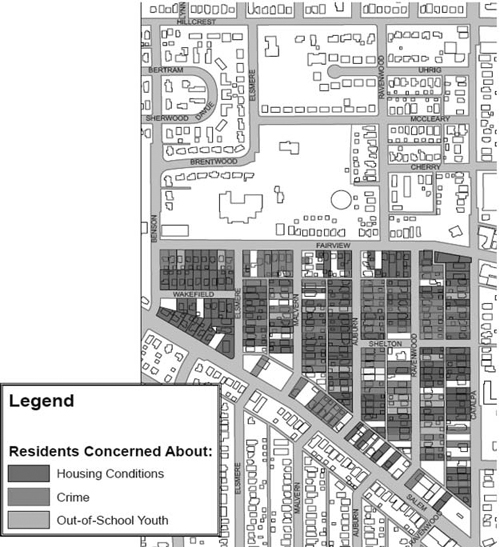
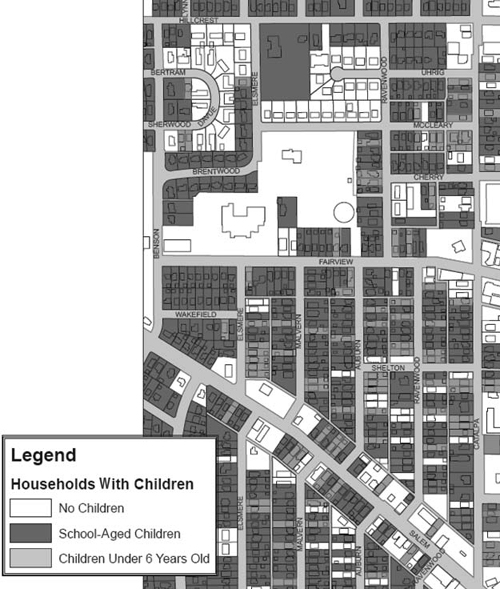
Figure 6.2 demonstrates another example, using census data to plot information about children in the neighborhood. The map displays households in the target area with children under age 6, school-age children, and no children. Using this data, the organizer may be able to help residents work with agencies to target programs more effectively. For example, organizers from the Family Service Association in Dayton, Ohio, used a similar map to work with residents to target school-age children for summer programs being offered in their neighborhoods as part of a redevelopment effort. Instead of a generic mailing, a map was developed to display the homes where youth lived who were eligible for the program. The agency developed a door-knocking campaign to get the word out about the program, targeting the homes with eligible children. These strategies produced a tremendous response, and the agency was extremely successful in generating participation in the program.
While data collection and GIS mapping are ongoing strategies that can help inform the organizer’s work and the development of specific organizing strategies, nothing replaces information gathered in “real time.” Neighborhoods are fluid places where change is constant. It is important for the organizer to continue to build relationships as a primary method for gathering information on changes in the neighborhood as they occur, and for uncovering new concerns and issues that residents care about.
Strategic Questions for Step One
While consensus organizers are gathering information on communities, they are simultaneously analyzing the information and piecing it together, analyzing the community’s strengths and weaknesses, important historical events that have left an impression on residents and can influence the current organizing effort, the major resources inside and outside the community, its appearance, characteristics, and relationship to the wider community or metropolitan region. Table 6.3 presents strategic questions that consensus organizers can ask as they gather information about a community and piece it together. Use these questions to sort through and analyze what you have found out about the community, and determine what you still need to know in order to understand the community better.
Name and Boundaries:
|
History and Current Conditions:
|
Gathering Places/Sense of Community:
|
Resources, Institutions:
|
Discussion Questions
1. What is purpose of Step One of the community analysis? How is this purpose the same and/or different than other types of community studies, including conducting a needs assessment?
2. What strategies does a consensus organizer use to gather information for Step One of the community analysis? How are these strategies the same and/or different than how information is gathered for other types of community studies, including needs assessments?
3. What are the most important things that you would want to learn during this step? How do you think these things could help you as you begin to meet with community residents?
Case Study Exercise
Instructions: Read the following case study on the Consensus Organizing Demonstration Program (CODP) and the Palm Beach County, Florida Development Team, which utilized consensus organizing to expand the community development industry in areas where it had not previously existed. This case study will also be used in Chapters 7 and 8 and in the Wrap-Up for Section III. Break into small groups to complete this exercise, and then have a large group discussion to share your answers.
Step One of the Community Analysis: Palm Beach County Development Team
The Consensus Organizing Demonstration Program (CODP) grew out of Mike Eichler’s work with the Local Initiatives Support Corporation (LISC) in the Mon Valley, Pennsylvania and in Houston, Texas (Eichler, 2007). LISC is an intermediary that raises funds nationally from foundations and corporations for community development. LISC uses these funds to match funds that are raised locally by corporations, financial institutions, and foundations. The CODP was designed to test the consensus organizing model in other areas of the country and expand the national community development industry into places where it had not previously existed (Chaskin, Brown, Venkatesh, & Vidal, 2001). The three initial CODP sites included Little Rock, Arkansas, New Orleans, Louisiana, and Palm Beach County, Florida (Eichler). Eichler assisted LISC in selecting these cities by making a series of site visits to conduct a preliminary community analysis, speaking with residents and other individuals familiar with low-income neighborhoods in the area, including corporate, government, social service, and philanthropic leaders (Gittell & Vidal, 1998). The two most important criteria for inclusion in the program were “demonstrated need for community development to give the program credibility, and a pool of motivated prospective volunteers with leadership potential—to permit the program to achieve the desired scale” (Gittell & Vidal, 1998, p. 71). In addition, the potential sites had to have corporate sector leaders who would support the initiative with their time and resources.
Core Strategies and Program Design
The core strategies of the Consensus Organizing Demonstration Program included (Chaskin, Brown, Venkatesh, & Vidal, 2001):
- broad-based involvement from the neighborhoods selected and activities designed to achieve tangible results in those neighborhoods;
- teaching real estate development to volunteers in neighborhoods in a clear, straightforward manner;
- engagement and leadership development of members from the neighborhoods and the external power structure;
- parallel organizing in the neighborhoods and among members of the external power structure;
- connections and relationships developed among neighborhood stakeholders and external players; and
- the potential for success (versus the extent of neighborhood needs and problems) was used to motivate residents and build their confidence.
Each CODP site had a local coordinator and three community organizers, whose first job was to conduct a community analysis of nine to 12 potential neighborhoods for the local program (Gittell & Vidal, 1994). The community analysis was intended to create “healthy competition among neighborhoods, establish momentum for organizing efforts in the neighborhoods selected, and further [community]-wide support and enthusiasm for Development Team efforts” (Gittell & Vidal, 1994, p. 7). Six neighborhoods would be selected based on the potential to engage and develop diverse, indigenous leaders, the community’s interest in the program, and residents’ willingness to volunteer to improve their neighborhoods (Gittell & Vidal, 1994). In addition, potential red flags were assessed, including identifying other competing community development efforts and recent negative experiences with community development that would make it difficult to engage volunteers. Other red flags included a blatant lack of public investment in the community.
Step One of the Community Analysis: Findings From Palm Beach County
When the demonstration program began in 1991, Palm Beach County had a strong economy, a very low unemployment rate (5%), and rapid population growth (Gittell & Vidal, 1998). However, there were significant income and racial disparities among the population between the wealthier areas (e.g., Palm Beach Island along the Atlantic Ocean) and most of the older neighborhoods located along the railroad tracks running parallel to the Intracoastal Waterway. These poor communities had suffered historically from racism and neglect, had the highest concentration of poverty and minorities, and lacked affordable housing, infrastructure, and other community resources (Gittell & Vidal, 1998).
Each consensus organizer was assigned three neighborhoods in which to conduct the community analysis. During Step One, the organizers gathered information about the history and characteristics of the following nine Palm Beach County neighborhoods: Boynton Beach, Delray Beach, Lake Worth, Limestone Creek (located in unincorporated Palm Beach County), Northwest Riviera Beach, Lake Park, Pleasant City, Grandview Heights/Flamingo Park, and Northwood. (The last three neighborhoods are located in the city of West Palm Beach.)
Table 6.4 highlights the main demographic characteristics of the nine neighborhoods from the 1990 and 1992 census data. And, by the way, back in the early 1990s the organizers had to look up the census data by hand—it wasn’t accessible on the Internet yet! Compared to the county as a whole, the nine neighborhoods had significantly lower median household incomes, and a higher minority population. Furthermore, they had higher percentages of renter-occupied and vacant housing and were much poorer than the county as a whole. Pleasant City had the highest percentage of individuals on public assistance (55%) versus the county as a whole (11%).
| County Data | Grandview/Flamingo | Northwood | Pleasant City | Limestone Creek | NW Riviera Beach | Lake Park | Lake Worth | Boynton Beach | Delray Beach | ||
| General Demographics | |||||||||||
| Population | 863,518 | 3,506 | 13,704 | 2,084 | 1,944* | 4,643 | 6,704 | 7,278 | 8,442 | 10,126 | |
| Race/ethnicity | |||||||||||
| White | 87% | 53% | 42% | 17% | 2% | 1% | 76% | 53% | 14% | 9% | |
| Minority | 13% | 47% | 58% | 83% | 98% | 99% | 24% | 47% | 86% | 91% | |
| Social Characteristics | |||||||||||
| Age 25+ no diploma | 21% | 38% | 34% | 55% | 22%* | 27% | 23% | 38% | 40% | 64% | |
| Economic Characteristics | |||||||||||
| Median HH income | $32,524 | $24,030 | $24,159 | $14,845 | $38,723* | $17.590 | $29,159 | $20,540 | $22,600 | $22,141 | |
| Unemployment rate | 5% | 14% | 11% | 10% | 17%* | 10% | 19% | 21% | 10% | 8% | |
| Labor force part. rate | 43% | 71% | 65% | 61% | 65%* | 69% | 61% | 65% | 63% | 69% | |
| Very low income | N/A | N/A | 17.4% | 40% | 16.5%* | 30% | N/A | N/A | 25% | 25% | |
| Low income | N/A | N/A | 28% | 40% | 20%* | 30% | N/A | N/A | 45% | 40% | |
| HH with public assistance | 11% | 7% | 18% | 55% | 4%* | 41% | 10% | 16% | 51% | 53% | |
| Housing Characteristics | |||||||||||
| Vacancy rate | 9% | 13% | 15% | 24% | 9%* | 12% | 13% | 21% | 13% | 15% | |
| Renter occupancy | 25% | 50% | 45% | 84% | 16%* | 42% | 42% | 52% | 35% | 49% | |
| Note: The first four neighborhoods are located in the City of West Palm Beach; HH = household. | |||||||||||
*Limestone Creek combined with higher-income area of Jupiter, FL.
Sources: Gittell and Vidal, 1998; U.S. Bureau of the Census, 1990 and 1992.
The consensus organizers discovered that two of the communities (Pleasant City and Lake Worth) both had organizations that were formed to do community development; however, these organizations were relatively new (Gittell & Vidal, 1994). Pleasant City’s group was formed by local pastors and was composed primarily of nonresidents. Lake Worth’s group was formed by the Lake Worth Concerned Citizens, who were primarily white homeowners concerned about the physical deterioration of the community.
None of the other communities had a community development corporation (CDC). Residents and business owners in Delray Beach were very active in local organizations, and were most interested in improving the West Atlantic Avenue area of the city. Residents in Riviera Beach were developing programs to help neighborhood youth stay away from drugs, and were interested in improving the northwest area of the city. The census data on Limestone Creek was skewed because if its inclusion with the higher-income area of Jupiter; however, the organizer was able to better understand the area when he visited and conducted walking and windshield surveys in the community. Limestone Creek was a very small, unincorporated community in northern Palm Beach County with approximately 200 to 300 families, many of whom were longtime residents. While there was clearly a blatant lack of public investment (e.g., lack of paved roads, water and sewer), several residents and church leaders wanted to improve their neighborhood and were interested in the program. Residents and business owners in Boynton Beach were interested in improving a deteriorated section of the community along Martin Luther King Boulevard. The Grandview Heights and Flamingo Park neighborhoods had strong neighborhood leaders working on efforts to fight crime and improve housing; however, these neighborhoods were undergoing a process of gentrification. Northwood was a deteriorated community, but past conflicts among residents and existing groups continued to fester over time. Lake Park was a primarily white community and was brought to the attention of the development team because of its proximity to deteriorated sections of Riviera Beach.
Historically, migrant and domestic workers lived in the lower-income and minority neighborhoods along the railroad tracks in Palm Beach County. For example, many of the domestic workers for the wealthy families in Palm Beach lived in Pleasant City because of its location directly across from Palm Beach. In Limestone Creek, the original settlers were migrant workers for the local orange grove, who decided to make the community their home.
Questions About the Case Study on Palm Beach County
1. What criteria were used to select the three main sites for the Consensus Organizing Demonstration Program (CODP) in Palm Beach County, Little Rock, and New Orleans? __________________________________________________________________________
__________________________________________________________________________
__________________________________________________________________________
__________________________________________________________________________
2. What were the core strategies of the CODP? __________________________________________________________________________
__________________________________________________________________________
__________________________________________________________________________
__________________________________________________________________________
3. What were the overall goals of the community analyses completed in the neighborhoods in Palm Beach County? __________________________________________________________________________
__________________________________________________________________________
__________________________________________________________________________
__________________________________________________________________________
4. What did the consensus organizers do in Step One of the community analysis in Palm Beach County? __________________________________________________________________________
__________________________________________________________________________
__________________________________________________________________________
__________________________________________________________________________
5. What preliminary observations can you make about the nine potential communities, based on the information presented in this case study? What else would you want to learn about these communities? What would you do to get this information? __________________________________________________________________________
__________________________________________________________________________
__________________________________________________________________________
__________________________________________________________________________
In-Class Exercise: Getting Started on Step one of the Community Analysis
Instructions: Select a community that you are familiar with (e.g., the neighborhood you grew up in, the one where you live or work now). Use Worksheet 6.1 to start thinking about what you already know about the community, and what you would still like to learn about. Approach this exercise as if you were a consensus organizer who was recently hired to work in this community. Afterwards, answer and discuss the following questions in a large group.
1. What aspects of your community are you most familiar with? Why? __________________________________________________________________________
__________________________________________________________________________
__________________________________________________________________________
__________________________________________________________________________
2. What do you still want to learn? Why? __________________________________________________________________________
__________________________________________________________________________
__________________________________________________________________________
__________________________________________________________________________
3. Where and how would gather information about your community? What steps would you take? __________________________________________________________________________
__________________________________________________________________________
__________________________________________________________________________
__________________________________________________________________________
4. Why do you think the information gathered in Step One of the community analysis is important for community organizing? How would you use this information? __________________________________________________________________________
__________________________________________________________________________
__________________________________________________________________________
__________________________________________________________________________
Name of Neighborhood: ________________________________________________________
| History, Culture, & Characteristics | Describe one fact about this neighborhood regarding the following areas: | Describe something you would still like to learn about this neighborhood: |
Neighborhood history, such as:
|
||
Current residents, such as:
|
||
Physical conditions, such as:
|
||
Economic Conditions
|
||
Social Conditions
|
||
Political Conditions
|
You can find some of the above information at the following locations:
- City or county planning departments, local libraries, organizations, chambers of commerce
- U.S. Census Bureau, community and organizational Web sites
- Interviews with community residents, businesses, organizations, and agencies
- Walking and windshield surveys
Field Exercise
Instructions: For this field assignment, select a neighborhood in which you will conduct an actual community analysis, and subsequently work with residents to design a consensus organizing intervention. You will use the same neighborhood to complete Steps Two and Three of the community analysis in field exercises in Chapters 7 and 8. Potential neighborhoods could include:
- the neighborhood where you are doing an internship or field placement,
- the neighborhood where you live and/or volunteer,
- a neighborhood where your employer is located or provides services,
- a neighborhood in which you currently work, and
- a neighborhood you are interested in learning more about.
At this stage of the community analysis, gather census data, information on community resources, and historical information. In addition, conduct both a “walking” and a “windshield” survey of the targeted neighborhood. For the walking survey, choose a location that is an active area of the community (e.g., preferably a business district) and walk through the area during the daylight hours. For the windshield survey, drive through the community and get a visual picture of the community. Create your own tables to present the demographic information from the census data comparing the data over time (e.g., the year 2005 with 1995). UseTables 6.1, 6.2, and 6.3 to assist you in conducting this step of the community analysis.
Suggestions for Students
Students completing this assignment could use it for a number of purposes, including:
- To assist your field or internship agency to reach out to a neighborhood they currently work in, and/or a new neighborhood to develop and/or expand programs and services
- To assist a community organization located in the target neighborhood to reach out to the community to engage new members
- To become involved in a neighborhood organization located in your own community.
Suggestions for Practitioners
Practitioners could use this assignment for a number of purposes, including:
- to develop community-based programs in the neighborhoods you are already working in,
- to engage and develop relationships in a new neighborhood, and
- to expand current programs in existing and new neighborhoods.
Use the following questions to write up an overall summary of your findings, including:
1. What tentative inferences or conclusions can you draw from the information you have gathered so far? __________________________________________________________________________
__________________________________________________________________________
__________________________________________________________________________
__________________________________________________________________________
2. How does the factual data (i.e., census data) compare with what you observed? __________________________________________________________________________
__________________________________________________________________________
__________________________________________________________________________
__________________________________________________________________________
3. What do you think are the potential strengths of the community? __________________________________________________________________________
__________________________________________________________________________
__________________________________________________________________________
__________________________________________________________________________
4. What are some of the issues that residents and other community stakeholders might want to address? __________________________________________________________________________
__________________________________________________________________________
__________________________________________________________________________
__________________________________________________________________________
5. Are there important institutions or organizations that you should consider in addressing community problems? If so, which ones? What makes these institutions important? __________________________________________________________________________
__________________________________________________________________________
__________________________________________________________________________
__________________________________________________________________________
References
Chaskin, R. J., Brown, P., Venkatesh, S., and Vidal, A. (2001) Building community capacity. New York: Aldine De Gruyter.
Coulton, C. (2005). The place of community in social work practice research: Conceptual and methodological developments.Social Work Research, 29(2), 73–86.
Eichler, M. (2007). Consensus organizing: Building communities of mutual self-interest. Thousand Oaks, CA: Sage.
Gittell, R., & Vidal, A. (1998). Community organizing: Building social capital as a development strategy. Thousand Oaks, CA: Sage.
Gittell, R., & Vidal, A. (1994). Community organizing as a development strategy: Interim report on Palm Beach County. New York: Graduate School of Management and Urban Policy, New School for Social Research.
Maguire, D. J. (1991). An overview and definition of GIS. In D. J. Maguire, M. F. Goodchild, & D. W. Rind (Eds.), Geographic information systems: Principles and applications, Vol. 1, Principles (pp. 9–20). New York: John Wiley & Sons.
U.S. Bureau of the Census. (1992). Census of population and housing, 1990. STF3A. Washington, DC: Author.
Do you need a similar assignment done for you from scratch? We have qualified writers to help you. We assure you an A+ quality paper that is free from plagiarism. Order now for an Amazing Discount!
Use Discount Code "Newclient" for a 15% Discount!
NB: We do not resell papers. Upon ordering, we do an original paper exclusively for you.

 We are an online Writing Agency that specializes in writing and editing nursing essays and academic assignments..
 Have any questions? Talk to us…